
Data ingest workflow monitoring
Data ingest workflow monitoring
The wis2box-stack includes a Grafana service to provide pre-configured moniting dashboards, based on metrics collected by Prometheus and logs stored by Loki.
To access the Grafana service, visit http://<your-host-ip>:3000 in your web browser.
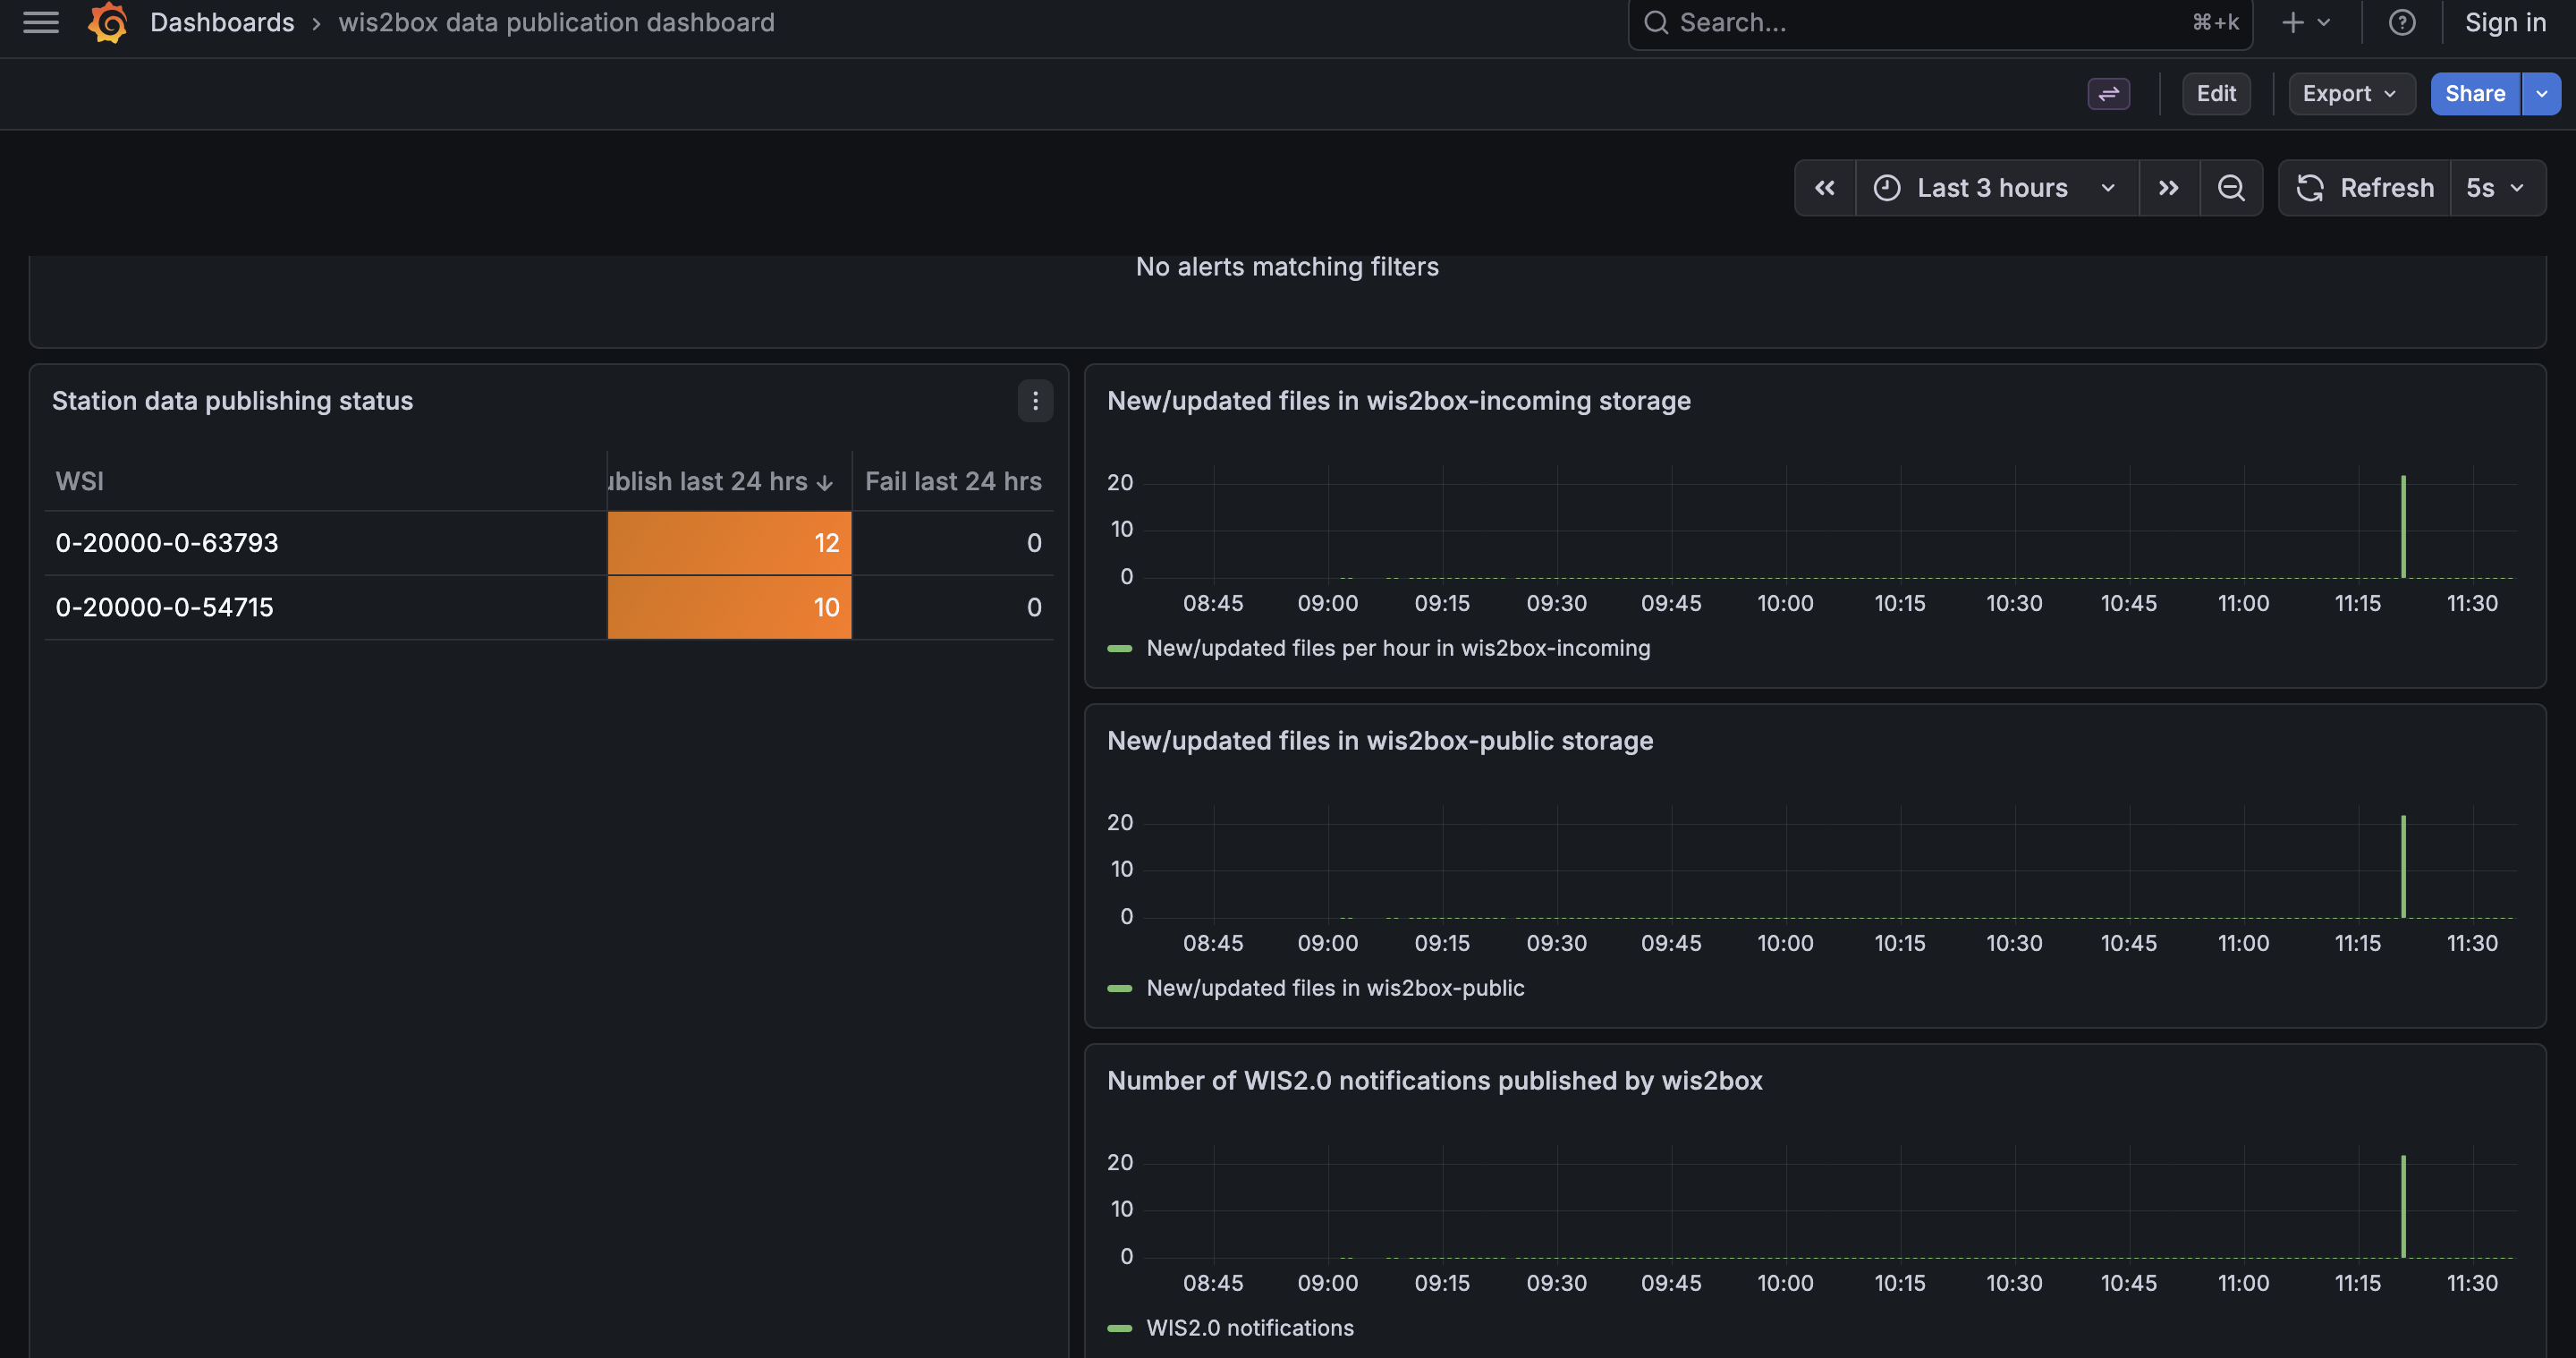
The Grafana homepage shows an overview with the number of files received, new files produced and WIS2 notifications published.
The Current Alerts Overview panel (at the top) displays active alert rules and their status.
The Station data publishing status panel (on the left side) shows an overview of notifications and failures per configured station.
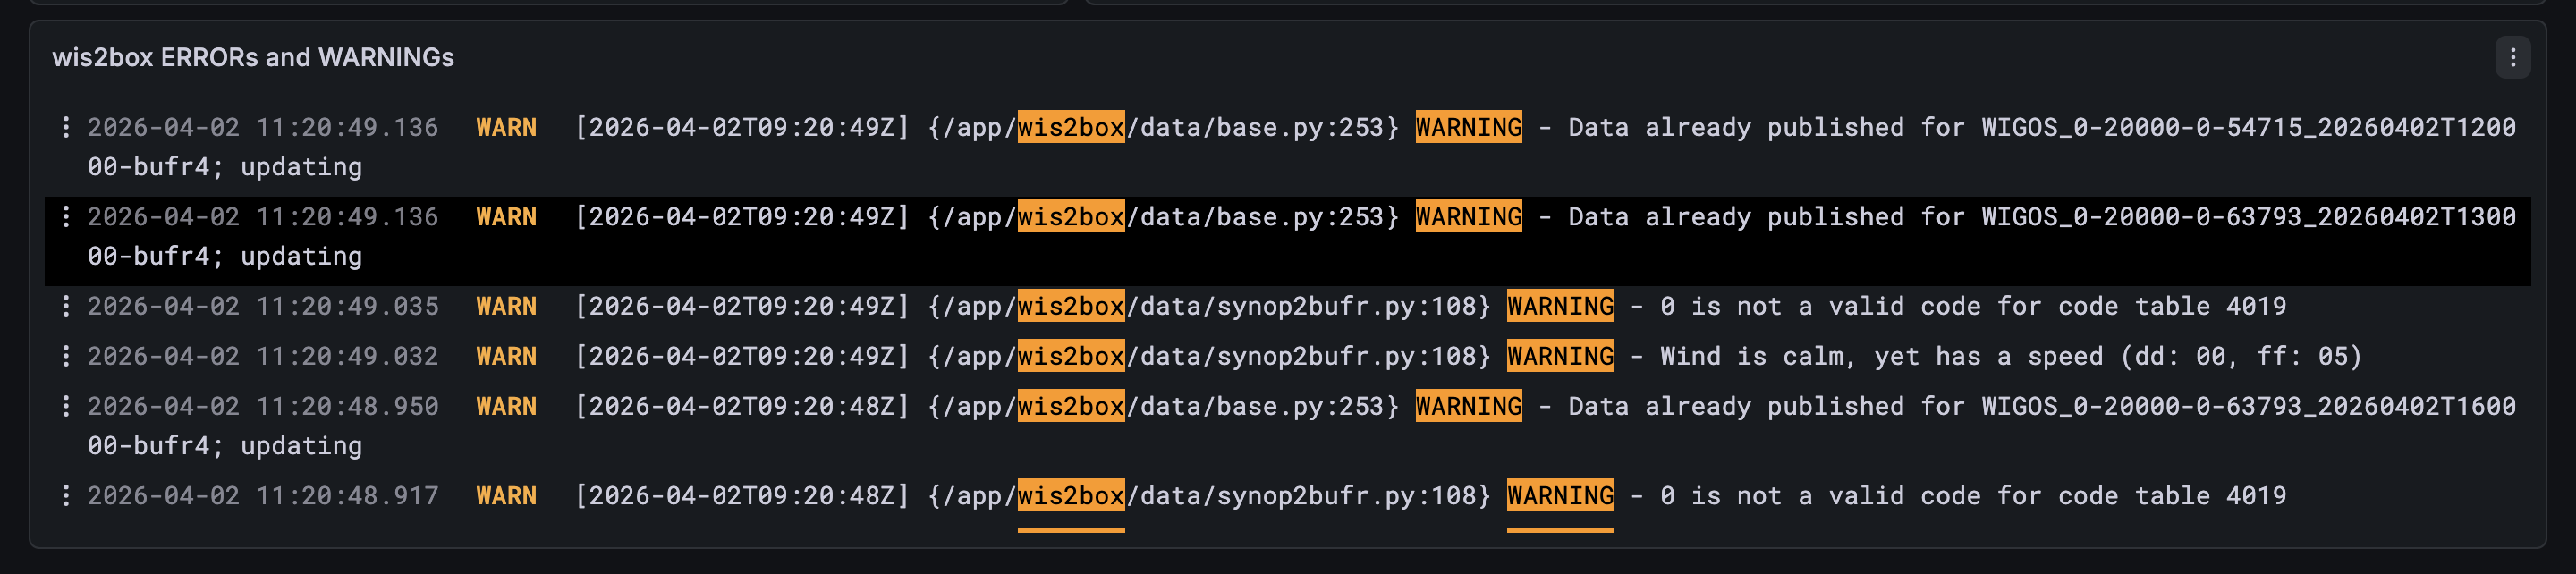
The wis2box ERRORs panel (on the bottom) prints all ERROR messages reported by the wis2box-management container.
The ‘EXPLORE’-option available in the left hand side allows you to see the full logs of all containers running on the wis2box-instance.
To access the logs, select ‘wis2box-loki’ as the data-source and ‘container_name’ as the label.
For more details on the monitoring stack in wis2box, see the Grafana dashboards section in the reference guide.